
Last second scaling hack
So, you have an app. You can’t change the code. Now this isn’t the common case when I try to scale things. I usually roll up my sleeves and ignore application stack boundaries. This is a unique case where for political reasons, I can’t touch the app. So.. the app was a tiny little site, then it got popular on facebook and collegehumor and instead of pushing 5-10 megabits, it was falling apart at around 105 megabits due to resource saturation (one box wasn’t enough) and ended up needing to push 200 megabits.
200 megabits isn’t all that much traffic anymore, but when the application wasn’t written to scale horizontally, you are at the mercy of its raw performance and must scale vertically. If the application hasn’t had a lot of focus on profiling and performance tuning, it means you are going to hit that extremely painful price point of vertical scaling. In this case, the architecture went live with an expectation of a 20Mbit/s peak and BOOM. Because it needed to be fixed quickly, purchasing new hardware is now a problem for scheduling reasons more than financial ones, we have plenty of similar hardware available, just nothing with twice the RAM and twice the cores and twice the disks.
The reason that this app couldn’t scale is because it used not only a shared DB (which is very very common) it required filesystem use and thus needed a shared filesystem. So, how do you fix that without modifying the app? You study the app and look for patterns of use that can be exploited.
First we looked at the database. In this case, it was not being pushed very hard. We could easily handle a tenfold increase in traffic without exhausting database resources… That was a relief, because scaling a database “behind the scenes” without any application access can be more than a few hour exercise. Next we found that the app itself (PHP) was taxing memory, CPUs and disk I/O pretty heavily. The most important was memory and CPU, but disk I/O was a close second. This meant that if we just installed the app on another machine and NFS exported the first machine’s mounts, it would “work” but not achieve out performance requirements because of I/O saturation. Quick testing in this arena showed about 15% increase in capacity – just not enough.
So, this app needs a shared FS. Why? Well the user uploads assets, and then through the life of their session, the app serves them back to that user. EASY, session sticky load balancing (by source IP or by introduced cookie on the load balancer). Because of the nature of this app, session sticky load balancing produced extremely inequitable load distribution and we would have had to bump up to three servers. Not ideal, but acceptable – this is triage. One step forward, flat on our face: it appears that under certain circumstances, the images I upload are served to another.
So, basically, all I need is to glue the static assets (uploaded by users) together under a common URL (and push 200Mbs or so). Some assets are on one server, some on another, and I have no way of knowing which server owns the asset without looking in the FS… or asking over HTTP and getting a 404 back.
I just happen to have a Varnish instance to provide content acceleration for other bits of infrastructure. And Varnish has (as its major selling point, IMO) the VCL language that allows me to script how it handles requests and satisfies them.
If I get a request, I want to try server one, if I get a 404, I’d like to retry the request against server two. As the number of servers goes up, this solution completely falls apart as the 404 isn’t that cheap. I want it fast, efficient, and it’d be great to cache it. If it isn’t fast and efficient, I’ve simply moved my problem instead of addressing it. This works well because serving a 404 on server one is cheap. Remember, triage.
backend obscuredserver1 {
   .host = "10.225.209.89";
   .port = "80";
}
backend obscuredserver2 {
   .host = "10.225.209.90";
   .port = "80";
}
sub vcl_recv {
   if (req.http.host ~ "^fqdn\\.of\\.caching\\.server$") {
     if (req.restarts == 0) {
       set req.backend = obscuredserver1;
     } else {
       set req.backend = obscuredserver2;
     }
   }
   if (req.request != "GET" && req.request != "HEAD") {
     pipe;
   }
   lookup;
}
sub vcl_fetch {
   if (req.http.host ~ "^fqdn\\.of\\.caching\\.server$" &&
       req.restarts == 0 && obj.status == 404) {
     restart;
   }
   if (!obj.cacheable) {
     pass;
   }
   if (obj.http.Set-Cookie) {
     pass;
   }
   set obj.prefetch = -30s;
   deliver;
}
Now, this is a excerpt, my varnishes here have some other logic for other services that I can’t share… However, they are rather lightly used. That particular instance went from serving an average of 6 Mbits/second to peaking at 200 Mbits/second. And the system load jumped from 0.01 to 0.06. It’s nice when a triage exercise results in a quick hack that doesn’t bust at the seams – we’ve got plenty of headroom.
While I, in no way, consider this successful scaling. I consider it successful triage by creative engineering (a.k.a. hack). And for those that like pretty pictures, these demonstrate that when you encounter capacity issues, it isn’t always pretty and graceful. Queueing theory is complicated and sometimes results in everyone getting screwed. Here’s a visualization of queueing theory making trouble.
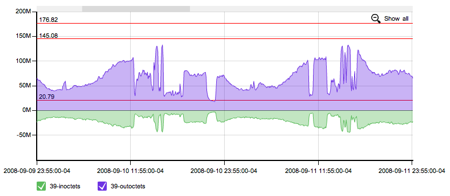
Queueing theory rears its ugly head
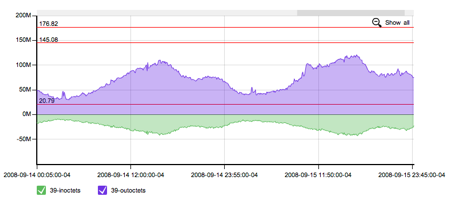
What it looks like with some headroom.
